
Twenty-six weeks, three threat windows, and equipment you can’t order in time
Two named storms have formed in the Atlantic this year. Arthur came ashore on the Texas coast in June and dropped record rainfall across Louisiana. Bertha formed south of the Florida panhandle in July and made landfall in St. Bernard Parish. Neither reached hurricane strength. By this point in a normal season the Atlantic has produced eight named storms, three of them hurricanes.
NOAA’s August 6 update put the odds of a below-normal season at 75 percent and trimmed the full-season forecast to seven to thirteen named storms, with zero to two majors. The reason is El Niño, which has strengthened faster than forecasters expected and is now running at roughly a 90 percent chance of reaching strong or very strong conditions through October.
If you operate a facility on the Gulf Coast, that is genuinely good news for the next ninety days.
It is not good news for January.
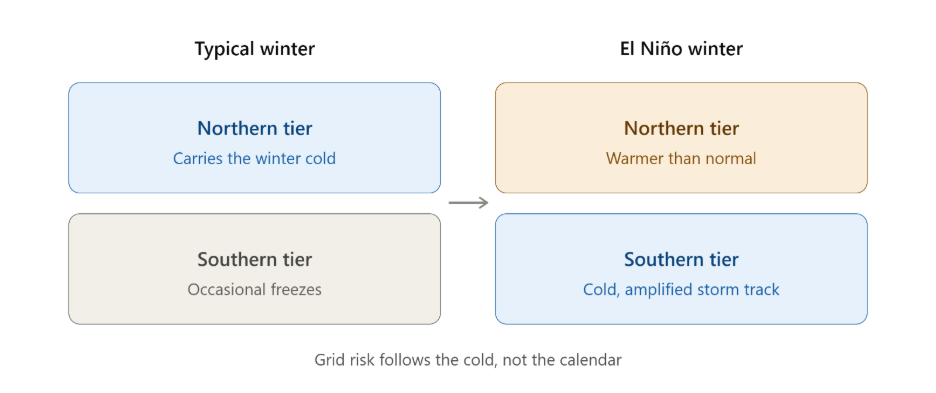
The same Pacific pattern that shears apart Atlantic storms also pulls the subtropical jet stream south for the winter. In a classic El Niño, that means more frequent storm systems tracking across Texas, the Gulf, and the Southeast, with the northern tier running warmer than average. NOAA’s climate models put a 97 percent chance on El Niño persisting into early spring, and its peak intensity is expected somewhere between November and January. NOAA has also been unusually direct about the uncertainty: a record-strength event could produce atmospheric impacts nobody has observed before.
Read that against a map of the U.S. grid and the implication is uncomfortable. Winter risk is being steered toward the part of the country with the thinnest cold-weather margin in its power infrastructure. Texas and the Southeast do not lose power to cold because the cold is severe by Minnesota standards. They lose power because a 15°F morning is rare enough there that the gas system, the generation fleet, and the people operating both have less practice.
Three seasons, three different failure modes
Facility teams tend to build one emergency plan and reuse it. The next six months contain three distinct events that fail in different ways and need different preparation.
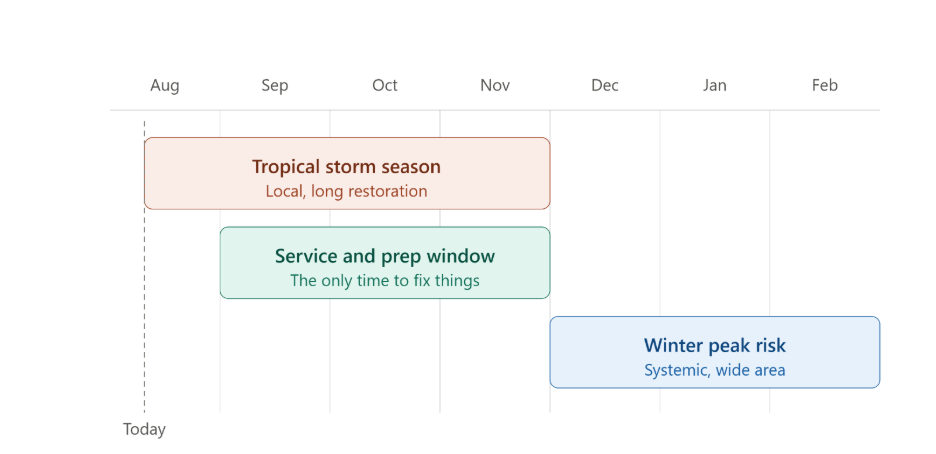
Hurricane and tropical season, now through November 30. The forecast is quiet, and quiet forecasts have a specific hazard attached to them. In 2024 NOAA correctly predicted a hyperactive season, and Helene still surprised nearly everyone by delivering its worst damage six hundred miles inland across western North Carolina and eastern Tennessee, at a total cost near $78.7 billion. The storm count is a poor proxy for your exposure. One landfall near a population center writes the whole season’s history.
Worth noting that both storms so far formed in the Gulf rather than tracking across the Atlantic, which is the pattern El Niño tends to favor: less long-track development, more homegrown Gulf systems with short lead times. A storm that organizes 200 miles offshore gives you about 36 hours, not five days. Also, El Niño makes the eastern and central Pacific basins more active, and NOAA is forecasting active seasons in both.
Outage profile here is long and wide. Distribution damage, flooded substations, road access problems that delay both restoration crews and fuel deliveries. Multi-day to multi-week.
Fall shoulder season, September through November. The quiet stretch, and the only window in which you can still fix anything. Generation units come offline for scheduled maintenance in the fall, which is why PJM’s May squeeze this year involved a heat event landing on top of a maintenance outage schedule. Mild fall weather is not the same as a resilient fall grid.
Winter, December through February. The event that actually breaks things. Not because winter storms are worse than hurricanes, but because winter shortfalls are systemic rather than local. A hurricane takes down lines between the plant and you. A winter event takes down the plants.
What changed on the grid this year
Load growth has broken from its historical pattern in a way that shows up in every reliability document published in the last eight months.
NERC’s Long-Term Reliability Assessment, released January 29, projects winter peak demand growing by 245 gigawatts over the next decade. That is 65 percent higher than the same assessment projected one year earlier. Summer peak growth was revised up by a similar margin. NERC noted the compound annual growth rates are the highest it has recorded since it started tracking in 1995. Thirteen of twenty-three North American assessment areas now carry elevated or high resource adequacy risk within five years.
Data centers are the primary driver. Goldman Sachs Research has U.S. data center power demand going from 31 GW in 2025 to 66 GW in 2027, taking them from 4.1 percent of national peak summer demand to 8.5 percent in two years.
The grid has already been tested against this twice in 2026, and the record is worth reading carefully because both tests ended without blackouts and both ended that way for reasons that are not repeatable indefinitely.
In late January, Winter Storm Fern pushed PJM toward a projected all-time winter peak near 147,000 MW, above the prior record of 143,700 MW set in January 2025. PJM expected demand above 130,000 MW for seven consecutive days, a streak it had never run. MISO declared an Energy Emergency Alert Level 2 across its North and Central regions. ISO-New England operated under a federal emergency order from January 25 through February 14, nineteen days, during which imports averaged only about 2,400 MW an hour because every neighboring region was cold simultaneously. New England generators switched from gas to oil on price, and then heavy snow created fuel oil delivery bottlenecks up the East Coast as generators across the Northeast bid for the same barrels.
In early July, a heat dome pushed PJM to forecast 166,147 MW against an all-time record of 165,563 MW that had stood since 2006. Operating reserves dropped to 5,091 MW from nearly 11,000.
Across 2026 the Department of Energy has issued 34 Section 202(c) emergency orders to grid operators. PJM has taken more than anyone.
There is a credible counterargument. Grid Strategies published analysis in March arguing NERC overstates the risk, largely by assuming more announced data center load will actually connect than probably will, alongside conservative assumptions about new generation and inter-regional transfers. Their follow-up review of the summer assessment concluded even New England and the Northwest were adequate under extreme conditions. That critique is worth taking seriously as a matter of capital planning. It does not change the operational picture for a single facility, because the margin that gets you through a February morning is measured in hours of reserve, not decades of forecast.
The part that creates the deadline
Whatever you decide to do about all of this, the equipment market decides when you can do it.
New utility-scale gas turbines are running about five years on average, with some quotes stretching to seven. Large power transformers are two to five years. The cost of a new gas-fired plant has more than tripled since 2021, from roughly $800 per kW to $2,600–2,800.
Standby generation is better but not fast. Current new-order lead times across the major manufacturers run roughly 12 to 26 weeks for 25–400 kW units, 12 to 39 weeks in the 750–1000kW range, and 52 to 70 weeks once you get into 1250–3250kW. Natural gas units in the 70–500kW range are quoting 26 to 39 weeks. Automatic transfer switches vary sharply by amperage and have their own way of becoming the bottleneck after everyone has focused on the generator.
Order a new 2MW standby unit this week and it arrives sometime in the back half of 2027. That single fact governs everything else in this playbook. For the season in front of you, the available moves are: recommission and prove what you already own, buy from existing inventory, or rent. New orders are a 2028 conversation.
Backup power has been given a second job
This is the shift that has not been widely absorbed, and it is the reason the word to use this year is resilience rather than backup.
During Winter Storm Fern, DOE issued an order authorizing PJM to direct the deployment of customer-owned backup generation to avoid load shed. PJM then worked with the agency to identify data center customers who had volunteered to run on their own generators if needed. In July, DOE went further and authorized PJM to curtail large loads of 50 MW or more, requiring them to switch to their own backup generation.
Texas has written the same idea into statute. Senate Bill 6 took effect for interconnection purposes on July 11, 2026, covering large loads of 75 MW or more at a single site. New large loads connecting after December 31, 2025 must install remote curtailment equipment. ERCOT now has authority to require large loads with sufficient backup generation to deploy it or curtail during emergencies. ERCOT’s own winter load forecast excludes large-load megawatts subject to SB 6 curtailment where the site has at least 50 percent backup generation installed.
On-site generation is now a variable inside the grid operator’s resource adequacy math. For large facilities it has stopped being purely defensive equipment and started being a piece of regional infrastructure that someone else may schedule.
Where the exposure concentrates
Texas and the western Gulf
The only region taking a hit in all three windows.
Hurricane exposure runs through November, and both storms this year formed in the Gulf with short lead times. Then the El Niño storm track moves directly over it. ERCOT is on NERC’s high-risk list, and the reason cited is persistent winter natural gas infrastructure limitations paired with demand growth.
The load numbers have no precedent. ERCOT entered 2026 with more than 233 GW of interconnection requests in its large-load queue, up 269 percent year over year, against a current all-time peak of 85,508 MW. Most of that queue will never energize and ERCOT says so, but even conservative reads push peak demand toward 98 GW inside the forecast window. Battery capacity approaching 17 GW has genuinely improved summer performance, and NERC rated ERCOT adequate for normal summer conditions this year. Batteries do less for a 6 a.m. January peak after an overnight draw-down, and solar does nothing at all.
ERCOT’s own probabilistic work put the chance of declaring an emergency alert on the forecast January peak day at about 2 percent, with controlled load shed at 1.8 percent. Those are not frightening numbers in isolation. They are also calculated against a normal winter, and this will not be one.
Most exposed: petrochemical and refining along the coast, water and wastewater utilities, cold storage, anything approaching the SB 6 threshold, and every commercial building whose freeze protection assumes the power stays on.
PJM: the Mid-Atlantic, Ohio Valley, and Chicago
The largest structural shortfall in the country, and the region that has been pushed near its all-time record in both directions in the same calendar year.
Independent market monitor Monitoring Analytics projects PJM roughly 6 GW short of its reliability requirement in 2027. PJM forecasts 32 GW of peak demand growth by 2030 with all but 2 GW from data centers. Capacity costs have risen roughly elevenfold to $333.44 per MW-day. NERC has PJM at elevated risk through 2028 and high risk from 2029.
The timing is the part buyers underestimate. PJM’s new interconnection cycle opened in April with a one-to-two year review. Nothing approved now helps this winter or the next one.
El Niño’s warmer northern signal cuts slightly in PJM’s favor for its northern zones. Its southern footprint, Virginia through Kentucky and Tennessee, sits in the storm track. Northern Virginia’s data center density sits in that same zone.
Most exposed: facilities on interruptible or curtailable tariffs who have been treating that classification as theoretical. Read your current language. What changed this year is that curtailment moved from voluntary to directed.
The Southeast and Mid-South
The region I would not have put on this list twelve months ago, and the one the El Niño pattern argues hardest for.
SERC-Central is on NERC’s high-risk list alongside the larger RTOs, covering the Tennessee Valley and adjacent parts of the South and Midwest. The storm track this winter points at it. So does the inland-flooding precedent from Helene, which caused its worst damage in exactly this geography.
The vulnerability is not the depth of cold. It is the frequency. A hard freeze across Tennessee, Alabama, Mississippi, and Arkansas hits heat pumps that lose efficiency and shift to resistance strip heat, driving a demand spike far steeper than the temperature drop suggests, on a system with a winter-peaking profile and gas infrastructure sized for a milder normal. MISO’s southern footprint through Louisiana and Arkansas shares the same problem, where a freeze is simultaneously a power event and a freeze-protection event for process equipment.
Most exposed: food processing and cold chain, poultry and agricultural operations, rural healthcare with long restoration queues, and manufacturing in the auto corridor running down through Tennessee and Alabama.
Also worth watching: MISO North and Central, which stays on NERC’s high-risk list on fundamentals even though El Niño’s warm northern signal moderates its weather risk this particular year, and which expects 8 to 14 GW of data centers online across 2026–2027. And New England, structurally the most fuel-constrained region in the country, which got through nineteen days of cold this year on a federal emergency order and imported oil.
The honest caveat on the forecast
NOAA’s official January-through-March outlook, issued in July, actually leans toward above-normal temperatures across large sections of the country, along with wetter conditions across the southern tier. That looks like it contradicts everything above.
It does not, and the reason matters for how you plan.
Seasonal outlooks describe averages across three months. Grids do not fail on three-month averages. They fail on 72-hour events. A winter can finish warmer than normal and still contain the single worst cold snap in a decade, and an El Niño pattern that amplifies the southern storm track raises the odds of exactly that kind of sharp, short, southern-weighted event. Winter Storm Uri arrived in a season that was not remarkable in aggregate.
Plan for the event, not the average.
What to do, and when
Now through mid-September. Run a current load study rather than using the one from the last building expansion. Loads have shifted with added IT, cooling, and EV charging, and undersized standby is the most common failure. Rank your genuinely critical circuits and check whether your existing transfer switch configuration actually matches that ranking; most facilities find it does not. Pull maintenance records and find the last full-load test date, not the last no-load exercise. Then make the buy, rent, or repair decision. The rental market clears early in a bad year.
Mid-September through October. Full service, including coolant with a verified freeze point and batteries tested under load. Load bank test at full rated capacity for at least two hours. This is the highest-value item on the list by a wide margin, because a weekly no-load exercise proves the engine starts and proves nothing about whether it carries the building at 4 a.m., while actively harming diesel units through wet stacking. Test transfer switches under real load transfer. Inspect and polish fuel, because diesel that sat since last winter has water and microbial growth in it.
November. Cold weather packages verified and drawing correctly: block heaters, battery warmers, coolant heaters, heat trace on exposed fuel lines. Winter-blend fuel or additive treatment matched to your actual regional low, since the gel point that works in Tennessee does not work in Illinois. Get a fuel resupply contract in writing with a defined response time, then ask the supplier what happens if all their customers call within the same twelve hours. That answer tells you how much on-site storage you really need. Size for a 72-hour run at realistic load. Most facilities are sized for 24.
December through February. Move to weekly exercise. Subscribe to your RTO’s operational alert feed, since cold weather alerts generally precede emergency conditions by 24 to 72 hours. Decide in advance who has authority to start preemptively and at what trigger, because in a directed-curtailment scenario you may have minutes. Log run hours and performance, which becomes the basis for participation if your region moves toward compensated emergency deployment.
Bottom line
The quiet hurricane season is not a reprieve. It is a signal about what the rest of the year looks like, and the pattern producing it is pointing winter weather at the regions with the least margin to absorb it.
The equipment lead times mean that whatever you are going to have running in January, you are choosing in the next few weeks. Facilities that come through cleanly will not be the ones that bought the most capacity. They will be the ones that load-tested in September and knew who was authorized to hit start.
Sources: NOAA National Hurricane Center and Climate Prediction Center seasonal outlooks (May, July, and August 2026); NERC 2025 Long-Term Reliability Assessment and 2026 Summer Reliability Assessment; U.S. Department of Energy Section 202(c) orders; PJM operational updates; ISO New England winter recap; ERCOT load forecast documentation; Texas Senate Bill 6; Goldman Sachs Research; Grid Strategies; Monitoring Analytics.